Skip to content

Instantly share code, notes, and snippets.

@sonots
Last active February 18, 2026 17:17
Show Gist options
  • Select an option

  • Save sonots/5abc0bccec2010ac69ff74788b265086 to your computer and use it in GitHub Desktop.

Select an option

Save sonots/5abc0bccec2010ac69ff74788b265086 to your computer and use it in GitHub Desktop.
How to use NVIDIA profiler

Usually, located at /usr/local/cuda/bin

Non-Visual Profiler

$ nvprof python train_mnist.py

I prefer to use --print-gpu-trace.

$ nvprof --print-gpu-trace python train_mnist.py

Visual Profiler

On GPU machine, run

$ nvprof -o prof.nvvp python train_mnist.py

Copy prof.nvvp into your local machine

$ scp your_gpu_machine:/path/to/prof.nvvp .

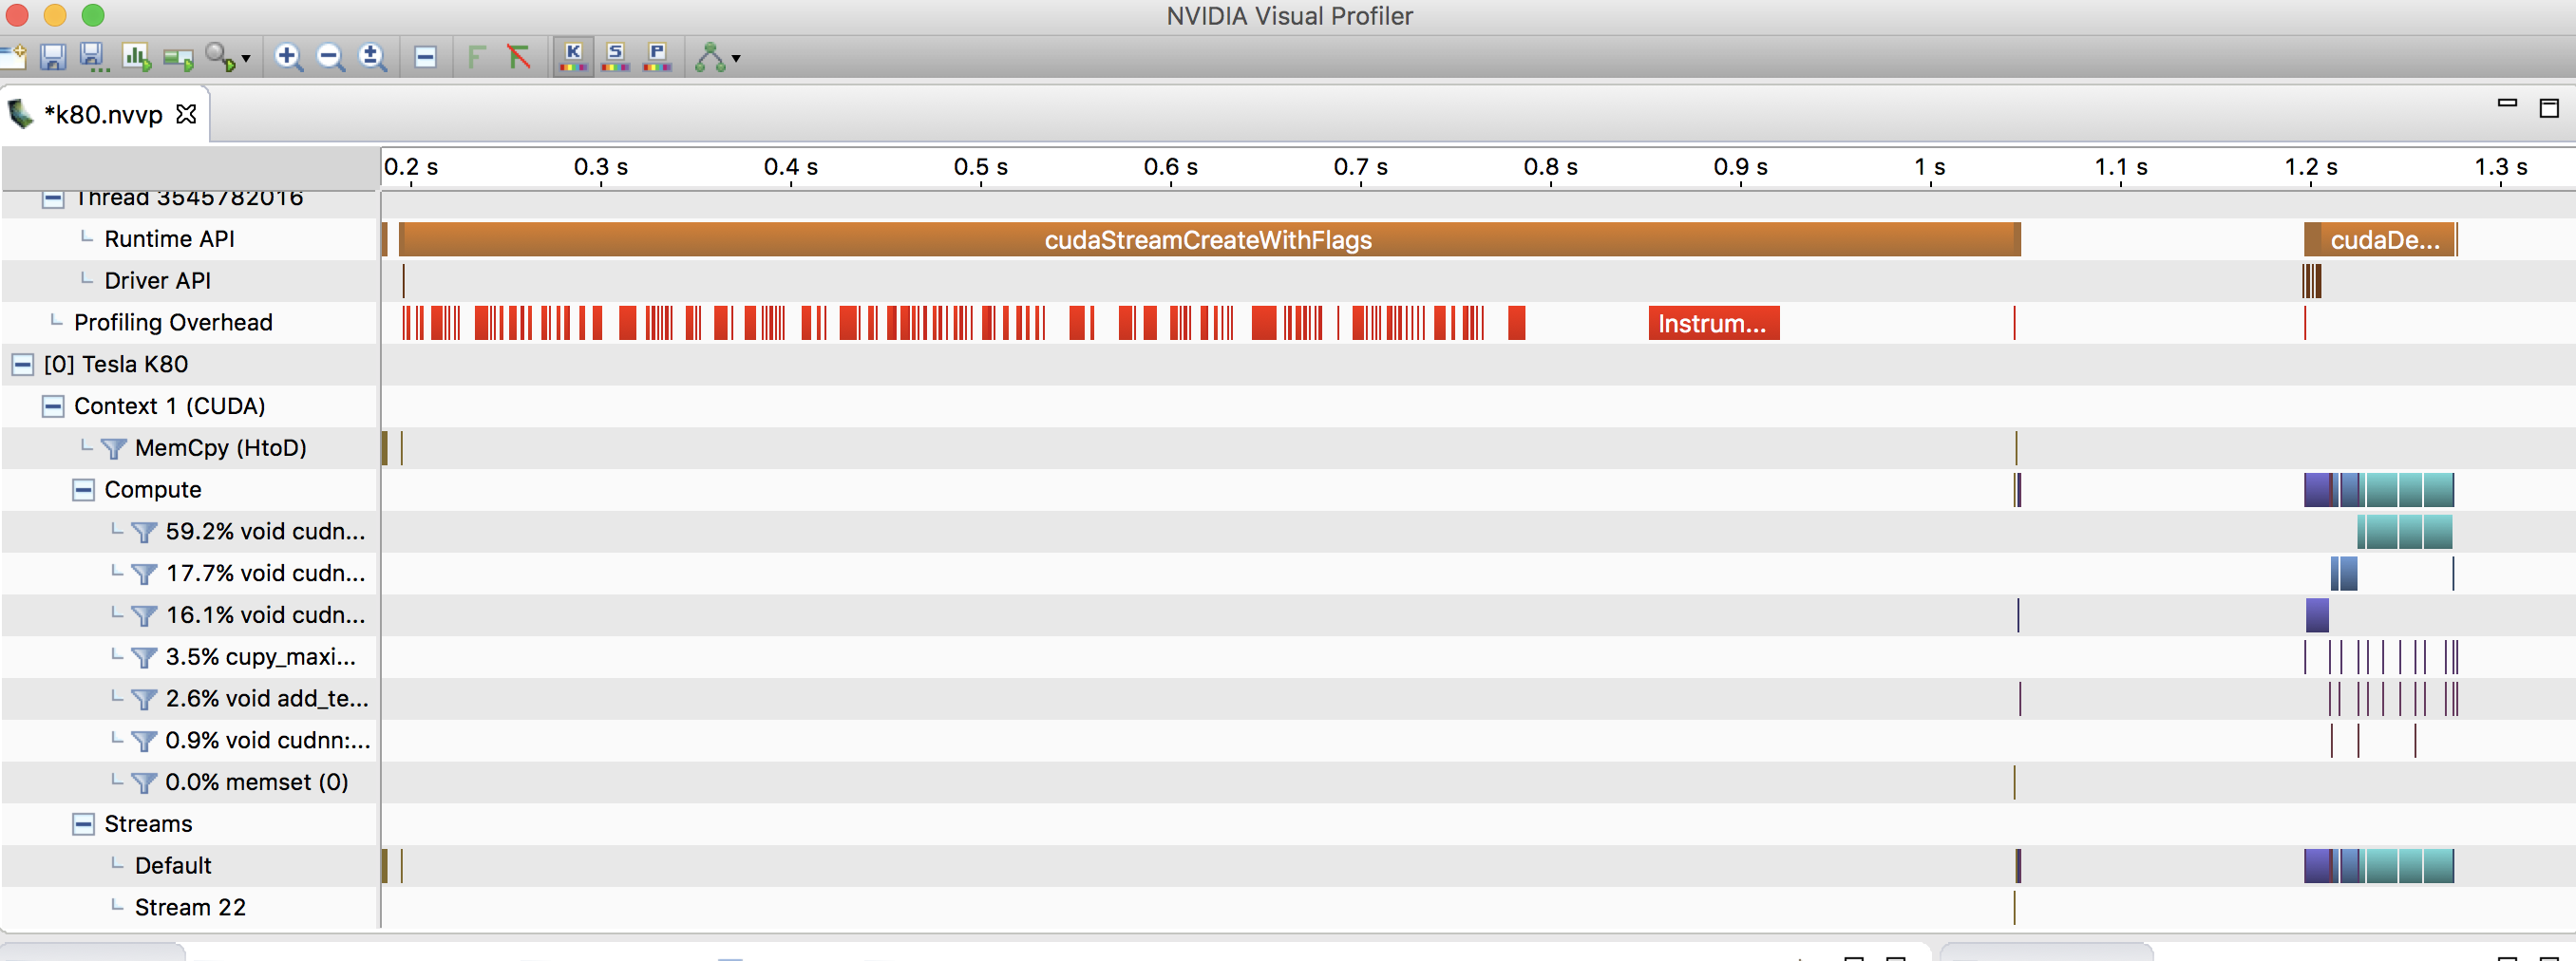
Then, run nvvp (nvidia visual profiler) on your local machine:

$ nvvp prof.nvvp

It works more comfortably than X11 forwarding or something.

@sonots
Copy link
Copy Markdown
Author

sonots commented Jul 11, 2017

For macOS: Install cuda toolkit for macOS. nvvp is included in it. Run nvvp command on console. You don't need GPU on your macOS.

https://developer.nvidia.com/cuda-downloads

$ /Developer/NVIDIA/CUDA-9.0/bin/nvvp prof.nvvp

@sonots
Copy link
Copy Markdown
Author

sonots commented Jul 21, 2017

@sonots
Copy link
Copy Markdown
Author

sonots commented Jul 21, 2017

@sonots
Copy link
Copy Markdown
Author

sonots commented Oct 19, 2017

An example of nvprof result:

$ nvprof python examples/stream/cusolver.py                                                                                                                                              [10/1910]
==27986== NVPROF is profiling process 27986, command: python examples/stream/cusolver.py
==27986== Profiling application: python examples/stream/cusolver.py
==27986== Profiling result:
Time(%)      Time     Calls       Avg       Min       Max  Name
 41.70%  125.73us         4  31.431us  30.336us  33.312us  void nrm2_kernel<double, double, double, int=0, int=0, int=128, int=0>(cublasNrm2Params<double, double>)
 21.94%  66.144us        36  1.8370us  1.7600us  2.1760us  [CUDA memcpy DtoH]
 13.77%  41.536us        48     865ns     800ns  1.4400us  [CUDA memcpy HtoD]
  3.02%  9.1200us         2  4.5600us  3.8720us  5.2480us  void syhemv_kernel<double, int=64, int=128, int=4, int=5, bool=1, bool=0>(cublasSyhemvParams<double>)
  2.65%  8.0000us         2  4.0000us  3.8720us  4.1280us  void gemv2T_kernel_val<double, double, double, int=128, int=16, int=2, int=2, bool=0>(int, int, double, double const *, int, double const *, i
nt, double, double*, int)
  2.63%  7.9360us         2  3.9680us  3.8720us  4.0640us  cupy_copy
  2.44%  7.3600us         2  3.6800us  3.1680us  4.1920us  void syr2_kernel<double, int=128, int=5, bool=1>(cublasSyher2Params<double>, int, double const *, double)
  2.23%  6.7200us         2  3.3600us  3.2960us  3.4240us  void dot_kernel<double, double, double, int=128, int=0, int=0>(cublasDotParams<double, double>)
  1.88%  5.6640us         2  2.8320us  2.7840us  2.8800us  void reduce_1Block_kernel<double, double, double, int=128, int=7>(double*, int, double*)
  1.74%  5.2480us         2  2.6240us  2.5600us  2.6880us  void ger_kernel<double, double, int=256, int=5, bool=0>(cublasGerParams<double, double>)
  1.57%  4.7360us         2  2.3680us  2.1760us  2.5600us  void axpy_kernel_val<double, double, int=0>(cublasAxpyParamsVal<double, double, double>)
  1.28%  3.8720us         2  1.9360us  1.7920us  2.0800us  void lacpy_kernel<double, int=5, int=3>(int, int, double const *, int, double*, int, int, int)
  1.19%  3.5840us         2  1.7920us  1.6960us  1.8880us  void scal_kernel_val<double, double, int=0>(cublasScalParamsVal<double, double>)
  0.98%  2.9440us         2  1.4720us  1.2160us  1.7280us  void reset_diagonal_real<double, int=8>(int, double*, int)
  0.98%  2.9440us         4     736ns     736ns     736ns  [CUDA memset]

==27986== API calls:
Time(%)      Time     Calls       Avg       Min       Max  Name
 60.34%  408.55ms         9  45.395ms  4.8480us  407.94ms  cudaMalloc
 37.60%  254.60ms         2  127.30ms     556ns  254.60ms  cudaFree
  0.94%  6.3542ms       712  8.9240us     119ns  428.32us  cuDeviceGetAttribute
  0.72%  4.8747ms         8  609.33us  320.37us  885.26us  cuDeviceTotalMem
  0.10%  693.60us        82  8.4580us  2.8370us  72.004us  cudaMemcpyAsync
  0.08%  511.79us         1  511.79us  511.79us  511.79us  cudaHostAlloc
  0.08%  511.75us         8  63.969us  41.317us  99.232us  cuDeviceGetName
  0.05%  310.04us         1  310.04us  310.04us  310.04us  cuModuleLoadData
  0.03%  234.87us        24  9.7860us  5.7190us  50.465us  cudaLaunch
  0.01%  50.874us         2  25.437us  16.898us  33.976us  cuLaunchKernel
  0.01%  49.923us         2  24.961us  15.602us  34.321us  cudaMemcpy
  0.01%  47.622us         4  11.905us  8.6190us  19.889us  cudaMemsetAsync
  0.01%  44.811us         2  22.405us  9.5590us  35.252us  cudaStreamDestroy
  0.01%  35.136us        27  1.3010us     289ns  5.8480us  cudaGetDevice
  0.00%  31.113us        24  1.2960us     972ns  3.2380us  cudaStreamSynchronize
  0.00%  30.736us         2  15.368us  4.4580us  26.278us  cudaStreamCreate
  0.00%  13.932us        17     819ns     414ns  3.7090us  cudaEventCreateWithFlags
  0.00%  13.678us        70     195ns     130ns     801ns  cudaSetupArgument
  0.00%  12.050us         4  3.0120us  2.1290us  4.5130us  cudaFuncGetAttributes
  0.00%  10.407us        22     473ns     268ns  1.9540us  cudaDeviceGetAttribute
  0.00%  10.370us        40     259ns     126ns  1.4100us  cudaGetLastError
  0.00%  9.9680us        16     623ns     185ns  2.9600us  cuDeviceGet

@sonots
Copy link
Copy Markdown
Author

sonots commented Oct 19, 2017

An example of nvprof --print-gpu-trace result:

$ nvprof --print-gpu-trace python examples/stream/cusolver.py
==28079== NVPROF is profiling process 28079, command: python examples/stream/cusolver.py
==28079== Profiling application: python examples/stream/cusolver.py
==28079== Profiling result:
   Start  Duration            Grid Size      Block Size     Regs*    SSMem*    DSMem*      Size  Throughput           Device   Context    Stream  Name
652.12ms  1.5360us                    -               -         -         -         -       72B  44.703MB/s  GeForce GTX TIT         1         7  [CUDA memcpy HtoD]
885.35ms  3.5520us              (1 1 1)         (9 1 1)        35        0B        0B         -           -  GeForce GTX TIT         1        13  cupy_copy [412]
1.17031s  1.2160us                    -               -         -         -         -      112B  87.838MB/s  GeForce GTX TIT         1         7  [CUDA memcpy HtoD]
1.17104s  1.2800us                    -               -         -         -         -        4B  2.9802MB/s  GeForce GTX TIT         1        13  [CUDA memcpy HtoD]
1.17117s  2.2400us                    -               -         -         -         -       72B  30.654MB/s  GeForce GTX TIT         1        13  [CUDA memcpy DtoH]
1.17119s     864ns                    -               -         -         -         -        4B  4.4152MB/s  GeForce GTX TIT         1        13  [CUDA memcpy HtoD]
1.17123s  1.3760us              (1 1 1)       (256 1 1)         8        0B        0B         -           -  GeForce GTX TIT         1        13  void reset_diagonal_real<double, int=8>(int, double*, i
nt) [840]
1.17125s     768ns                    -               -         -         -         -       16B  19.868MB/s  GeForce GTX TIT         1        13  [CUDA memset]
1.17127s  32.928us              (1 1 1)       (128 1 1)        30  1.0000KB        0B         -           -  GeForce GTX TIT         1        13  void nrm2_kernel<double, double, double, int=0, int=0,
int=128, int=0>(cublasNrm2Params<double, double>) [848]
1.17130s  30.016us              (1 1 1)       (128 1 1)        30  1.0000KB        0B         -           -  GeForce GTX TIT         1        13  void nrm2_kernel<double, double, double, int=0, int=0,
int=128, int=0>(cublasNrm2Params<double, double>) [853]
1.17134s  2.0160us                    -               -         -         -         -        8B  3.7844MB/s  GeForce GTX TIT         1        13  [CUDA memcpy DtoH]
1.17135s  1.7920us                    -               -         -         -         -        8B  4.2575MB/s  GeForce GTX TIT         1        13  [CUDA memcpy DtoH]
1.17137s  1.8560us              (1 1 1)       (384 1 1)        10        0B        0B         -           -  GeForce GTX TIT         1        13  void scal_kernel_val<double, double, int=0>(cublasScalP
aramsVal<double, double>) [863]
1.17138s     832ns                    -               -         -         -         -        8B  9.1699MB/s  GeForce GTX TIT         1        13  [CUDA memcpy HtoD]
1.17138s     864ns                    -               -         -         -         -        8B  8.8303MB/s  GeForce GTX TIT         1        13  [CUDA memcpy HtoD]
1.17139s  1.8240us                    -               -         -         -         -        8B  4.1828MB/s  GeForce GTX TIT         1        13  [CUDA memcpy DtoH]
1.17140s  1.8880us                    -               -         -         -         -        8B  4.0410MB/s  GeForce GTX TIT         1        13  [CUDA memcpy DtoH]
1.17141s     864ns                    -               -         -         -         -        8B  8.8303MB/s  GeForce GTX TIT         1        13  [CUDA memcpy HtoD]
1.17142s     832ns                    -               -         -         -         -        8B  9.1699MB/s  GeForce GTX TIT         1        13  [CUDA memcpy HtoD]
1.17143s  5.6320us             (64 1 1)       (128 1 1)        48  5.5000KB        0B         -           -  GeForce GTX TIT         1        13  void syhemv_kernel<double, int=64, int=128, int=4, int=
5, bool=1, bool=0>(cublasSyhemvParams<double>) [875]
1.17145s  3.9360us              (1 1 1)       (128 1 1)        14  1.0000KB        0B         -           -  GeForce GTX TIT         1        13  void dot_kernel<double, double, double, int=128, int=0,
 int=0>(cublasDotParams<double, double>) [882]
1.17146s  3.0400us              (1 1 1)       (128 1 1)        16  1.5000KB        0B         -           -  GeForce GTX TIT         1        13  void reduce_1Block_kernel<double, double, double, int=1
28, int=7>(double*, int, double*) [888]

[omitted]

@sonots
Copy link
Copy Markdown
Author

sonots commented Oct 19, 2017

An example of nvvp result:

image

image

@shizukanaskytree
Copy link
Copy Markdown

Thank you for your post!

@rohith14
Copy link
Copy Markdown

rohith14 commented Nov 1, 2018

Hi,
I get "No kernels profiled" as seen shown below. Any idea?

$ nvprof --print-gpu-trace python train_mnist.py --network mlp --num-epochs 1
INFO:root:start with arguments Namespace(add_stn=False, batch_size=64, disp_batches=100, dtype='float32', gc_threshold=0.5, gc_type='none', gpus=None, kv_store='device', load_epoch=None, lr=0.05, lr_factor=0.1, lr_step_epochs='10', model_prefix=None, mom=0.9, monitor=0, network='mlp', num_classes=10, num_epochs=1, num_examples=60000, num_layers=None, optimizer='sgd', test_io=0, top_k=0, wd=0.0001)
==27259== NVPROF is profiling process 27259, command: python train_mnist.py --network mlp --num-epochs 1
INFO:root:Epoch[0] Batch [100] Speed: 39195.15 samples/sec accuracy=0.779548
INFO:root:Epoch[0] Batch [200] Speed: 54730.25 samples/sec accuracy=0.915781
INFO:root:Epoch[0] Batch [300] Speed: 52417.13 samples/sec accuracy=0.923281
INFO:root:Epoch[0] Batch [400] Speed: 52111.75 samples/sec accuracy=0.935781
INFO:root:Epoch[0] Batch [500] Speed: 52394.11 samples/sec accuracy=0.946250
INFO:root:Epoch[0] Batch [600] Speed: 52185.51 samples/sec accuracy=0.947656
INFO:root:Epoch[0] Batch [700] Speed: 52354.36 samples/sec accuracy=0.953125
INFO:root:Epoch[0] Batch [800] Speed: 52180.64 samples/sec accuracy=0.958750
INFO:root:Epoch[0] Batch [900] Speed: 52312.02 samples/sec accuracy=0.953281
INFO:root:Epoch[0] Train-accuracy=0.955236
INFO:root:Epoch[0] Time cost=3.287
INFO:root:Epoch[0] Validation-accuracy=0.963774
==27259== Profiling application: python train_mnist.py --network mlp --num-epochs 1
==27259== Profiling result:
No kernels were profiled.

@Double1996
Copy link
Copy Markdown

Thank you very much!

@dorraghzela
Copy link
Copy Markdown

Hello,

Thank you for sharing this. I have a silly question actually, I want to know if the profiling time for example memcpy includes the time for the API call cudaMemcpy ??

Thank you

@jrevels
Copy link
Copy Markdown

jrevels commented Nov 1, 2019

Thanks!

To help out other MacOS users in case they run into the same problem I did:

Make sure to point nvvp to a supported version of the JRE:

/Developer/NVIDIA/CUDA-10.1/bin/nvvp -vm /Library/Java/JavaVirtualMachines/jdk1.8.0_151.jdk/Contents/Home/jre/bin/java

Also make sure that the argument to -vm is an absolute path; it doesn't seem to understand relative paths.

@dboyda
Copy link
Copy Markdown

dboyda commented Nov 13, 2019

@jrevels, Thank you!

There are also problems with the installation of the Cuda toolkit on Catalina. It can be solved by adding a link /Developer to any place. To do it on Catalina you need to add a line
Developer /Users/userName
to file /etc/synthetic.conf : like it is written here.

@sumit-byte
Copy link
Copy Markdown

Hello, iam having problem on viewing the visual profiler. Every time it open upon selecting a file it returns a error, saying "The application being profilled returned a non-zero code"

@HenryYihengXu
Copy link
Copy Markdown

Hello, do you know how to see GPU utilization with nvvp? I only see the duration of a function. But I want to also see the percentage of GPU utilization during a function.

@keke8273
Copy link
Copy Markdown

keke8273 commented Mar 4, 2020

i have to use the --profile-child-processes option to get the profile to work on windows.

@hudannag
Copy link
Copy Markdown

I get no outputs using nvprof. No matter if I give arguments or not.
Doesn't work with .exe file build with VS2019, nor using nvprof python program.py.

Can you please help?

@hitvoice
Copy link
Copy Markdown

On Mac, nvvp prof.nvvp doesn't work.
An absolute path (instead of a relative path like "prof.nvvp") has to be provided.

@danpovey
Copy link
Copy Markdown

My recommendation to anyone who wants to install nvvp on an up-to-date Mac (catalina) is not to even try.
Firstly you have to disable gatekeeper:
sudo spctl --master-disable
but then after you download nvvp it won't run because it wants an outdated java runtime (JRE) that's hard to get or install.
I still haven't figured it out.
Currently I'm trying to figure out how to do this, but it looks like it's very very painful.

@1chimaruGin
Copy link
Copy Markdown

Thanks man! Great help

@ccjjs
Copy link
Copy Markdown

ccjjs commented Jun 12, 2021

PDD XBJ GOD, YYDS

Sign up for free to join this conversation on GitHub. Already have an account? Sign in to comment