Last active
June 23, 2022 07:32
-
-
Save laurentperrinet/de76f53fcb0820844fbf0317ed832035 to your computer and use it in GitHub Desktop.
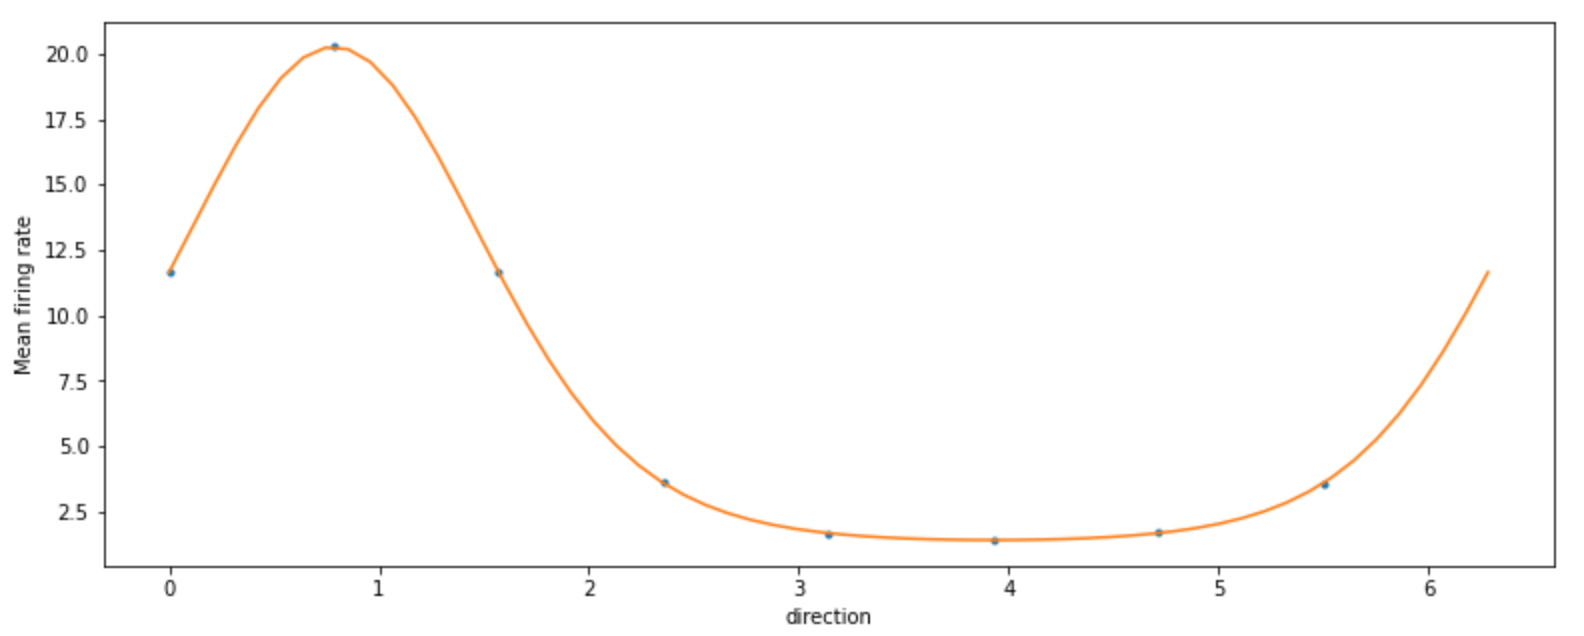
Quick function to fit a Von Mises distribution
This file contains hidden or bidirectional Unicode text that may be interpreted or compiled differently than what appears below. To review, open the file in an editor that reveals hidden Unicode characters.
Learn more about bidirectional Unicode characters
| import numpy as np | |
| # https://en.wikipedia.org/wiki/Von_Mises_distribution | |
| def tuning_function(theta, theta0, kappa, fmax, bsl, theta_bound): | |
| # Von Mises, with kappa the concentration, theta0 the location | |
| # fmax the firing rate at pref ori, bsl the min firing rate (not the baseline, which was substracted) | |
| tf = bsl + np.exp(kappa*(np.cos(2*np.pi/theta_bound*(theta-theta0))-1)) * (fmax-bsl) | |
| return tf | |
| # we will use the tutorial from https://lmfit.github.io/lmfit-py/model.html : | |
| from lmfit import Model, Parameters | |
| def fit_tc(array, init_kappa, theta_bound=2*np.pi): | |
| """ | |
| Fits the data points in `array` to `tuning_function`. | |
| set theta_bound to 2*np.pi for fitting signed angles (eg dirrection) | |
| or to np.pi for an unsigned one (like orientation) | |
| """ | |
| theta = np.linspace(0, theta_bound, len(array), endpoint=False) | |
| mod = Model(tuning_function) | |
| pars = Parameters() | |
| # name default vary min max | |
| pars.add_many(('theta0', theta[np.argmax(array)], True, 0., theta_bound), | |
| ('kappa', init_kappa, True, .1, 5.), | |
| ('fmax', np.max(array), True, 0.0, 2*np.max(array)+5), | |
| ('bsl', np.min(array), True, 0.0, np.max(array)+5), | |
| ('theta_bound', theta_bound, False)) | |
| out = mod.fit(array, pars, theta=theta, nan_policy='omit', max_nfev=50000) | |
| return out.best_values | |
| # test the function | |
| N_directions = 8 | |
| theta_bound = 2*np.pi | |
| theta = np.linspace(0, theta_bound, N_directions, endpoint=False) | |
| array = tuning_function(theta, theta0=np.pi/4, kappa=2., fmax=20., bsl=1., theta_bound=theta_bound) + 0.1*np.abs(np.random.randn(N_directions)) | |
| fitted_params = fit_tc(array, 3.5) | |
| import matplotlib.pyplot as plt | |
| fig, ax = plt.subplots(figsize=(13, 5)) | |
| ax.plot(theta, array, '.') | |
| theta_more = np.linspace(0, theta_bound, 60, endpoint=True) | |
| ax.plot(theta_more, tuning_function(theta_more, **fitted_params)) | |
| ax.set_xlabel('direction') | |
| ax.set_ylabel('Mean firing rate'); |
Author
Sign up for free
to join this conversation on GitHub.
Already have an account?
Sign in to comment
should produce something like