About Santiago: [email protected] @namessanti
Jaak Laineste
@jaakl
If you're new to CartoDB, making an account is easy. Just click THIS LINK and follow the instructions. These accounts are a level-up from our standard free accounts because we <3 you!
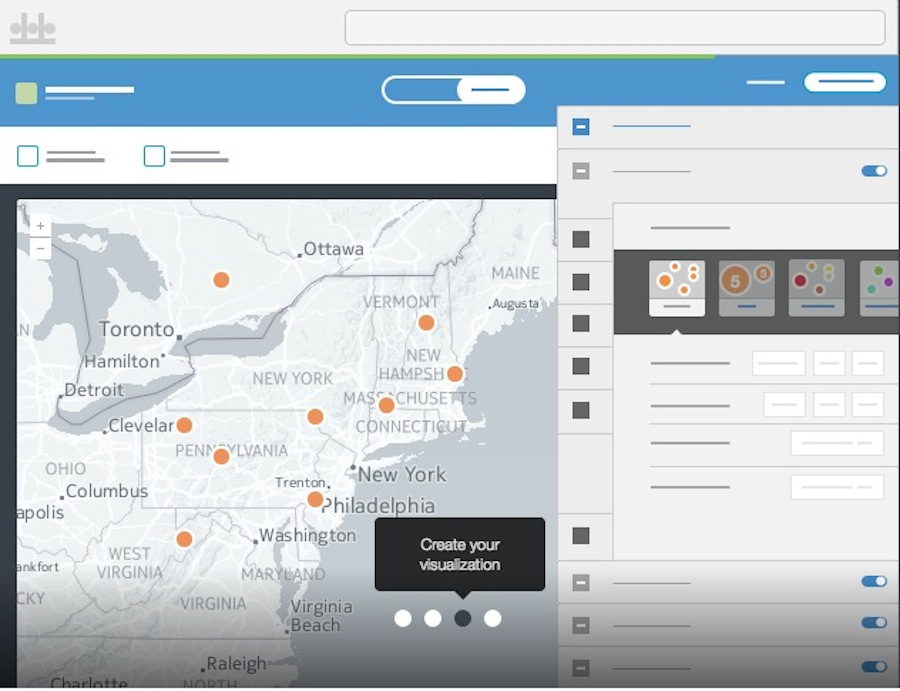
The Dasboard is like the command center for managing your datasets, maps, and account.

The blue bar on top allows you to:
- Navigate between your maps and datasets
- Datasets are the backbone of your map visualization. It is important to note that by switching to the datasets view, you can work with the data stored on the CartoDB database directly.
- Visit our CartoDB gallery
- Learn new skills on our documentation page.
By clicking the icon on the far right you can:
- Manage your account settings
- Visit your public profile
- View your API key
- Which will be important for using our APIs and some external tools such as OGR.

Let's begin by clicking the green New Map button. Then choosing to Make a map from scratch in the popup.

There are many ways to bring data into CartoDB.

From this area you can choose to:
- Create an empty map with no data
- Browse our ever growing data library
- Make a map with datasets you have already brought into CartoDB, or
- Connect a new dataset.
- This allows you to choose files from your computer, URL, or one of our connectors such as Twitter.
Keep in mind that you can also drag and drop datasets onto your dashboard at anytime and let CartoDB take care of the rest!
####Today we're going to be looking at loud music complaints in Austin.
#Let's begin by bringing in the loud music complaint data for Austin, TX by command-clicking (or right clicking) on THIS LINK and selecting to "Copy Link Address".
- Using a URL allows you to skip bringing data onto your computer as well as allowing users with certain plans to create automatically syncing and real-time maps
The CartoDB editor makes it easy to style your map, and run analysis or query your data.

- Tour of the Wizard
THe Style Wizard allows you to easily tap into CartoDB's Map design language CartoCSS.

The basic Syntax for CartoCSS is:
selector {
  property: value;
}
Map {
marker-fill: #ffcc00;
}- Changes you make in the wizard change the CartoCSS.
- By working with the CartoCSS directly, the styling possibilities are endless!
- Let's explore some conditional syling
- We can style in CartoCSS directly from your data
  [council_district = 1] {
    marker-fill: blue;
    marker-width: 7;
    marker-type: arrow;
  }
#Torque
#Let's go back to the dashboard and this time add a new dataset. This time we're going to use traffic accidents from Denver,CO using THIS LINK
- Datasets vs maps
Locate traffic_accidents and let's make a new visualization

Introduction to: duration, steps, trails, resolution

#traffic_accidents[frame-offset=2] {
 marker-width:10;
 marker-fill-opacity:0.225;
}
Offsets relate directly to -torque-frame-count:512;
Map {
-torque-frame-count:512;
-torque-animation-duration:30;
-torque-time-attribute:"cartodb_id";
-torque-aggregation-function:"CDB_Math_Mode(torque_category)";
-torque-resolution:2;
-torque-data-aggregation:linear;
}It's SQL embedded in CartoCSS!
CDB_Math_Mode(district_i)count(*)sum(income)#traffic_accidents[value=1] {
marker-fill: #A6CEE3;
}
Animated category maps use the aggregate function CDB_Math_Mode to generate values that dictate the map design. Let's see how this works:
Map {
-torque-frame-count:512;
-torque-animation-duration:30;
-torque-time-attribute:"cartodb_id";
-torque-aggregation-function:"CDB_Math_Mode(district_i)";
-torque-resolution:2;
-torque-data-aggregation:linear;
}
#traffic_accidents{
comp-op: source-over;
marker-fill-opacity: 0.9;
marker-line-color: #FFF;
marker-line-width: 1.5;
marker-line-opacity: 1;
marker-type: ellipse;
marker-width: 6;
marker-fill: #FF9900;
}
#traffic_accidents[frame-offset=1] {
marker-width:8;
marker-fill-opacity:0.45;
}
#traffic_accidents[frame-offset=2] {
marker-width:10;
marker-fill-opacity:0.225;
}
#traffic_accidents[value=1] {
   marker-fill: #A6CEE3;
}
#traffic_accidents[value=2] {
marker-fill: #1F78B4;
}
#traffic_accidents[value=3] {
marker-fill: #B2DF8A;
}
#traffic_accidents[value=4] {
marker-fill: #33A02C;
}
#traffic_accidents[value=5] {
marker-fill: #FB9A99;
}
#traffic_accidents[value=6] {
marker-fill: #E31A1C;
}
#traffic_accidents[value=7] {
marker-fill: #FDBF6F;
}Values are calculated within each geotemporal bin. It's a combination of -torque-frame-count and -torque-resolution

Let's take a look at this code to start:
Map {
-torque-frame-count:256;
-torque-animation-duration:30;
-torque-time-attribute:"first_occu";
-torque-aggregation-function:"count(cartodb_id)";
-torque-resolution:2;
-torque-data-aggregation:linear;
}
#traffic_accidents{
  comp-op: lighter;
  marker-fill-opacity: 0.9;
  marker-line-color: #FFF;
  marker-line-width: 0;
  marker-line-opacity: 1;
  marker-type: ellipse;
  marker-width: 1;
  marker-fill: #F84F40;
}
#traffic_accidents[value>2] {
 marker-width:2;
}
#traffic_accidents[value>3] {
 marker-width:4;
}
#traffic_accidents[value>4] {
 marker-width:8;
}
#traffic_accidents[frame-offset=1] {
 marker-width:2.5;
 marker-fill-opacity:0.2;
}
#traffic_accidents[frame-offset=2] {
 marker-width:4.5;
 marker-fill-opacity:0.1;
}
Let's look at this Map element.
Map {
-torque-frame-count:24;
-torque-animation-duration:30;
-torque-time-attribute:"first_occu";
-torque-aggregation-function:"count(cartodb_id)";
-torque-resolution:16;
-torque-data-aggregation:linear;
}
and the styles:
#traffic_accidents{
  comp-op: lighter;
  marker-fill-opacity: 0.9;
  marker-line-color: #FFF;
  marker-line-width: 0;
  marker-line-opacity: 1;
  marker-type: ellipse;
  marker-width: 1;
  marker-fill: #F84F40;
}
#traffic_accidents[value>3] {
 marker-width:2;
}
#traffic_accidents[value>5] {
 marker-width:3;
}
#traffic_accidents[value>7] {
 marker-width:6;
}
#traffic_accidents[value>10] {
 marker-width:8;
}
Going back to our category map, let's see what happens when we use Torque with no animation:
Map {
-torque-frame-count:1;
-torque-animation-duration:0;
-torque-time-attribute:"cartodb_id";
-torque-aggregation-function:"CDB_Math_Mode(district_i)";
-torque-resolution:1;
-torque-data-aggregation:linear;
}

#traffic_accidents{
  comp-op: source-over;
  marker-fill-opacity: 0.9;
  marker-line-color: #FFF;
  marker-line-width: 1.5;
  marker-line-opacity: 1;
  marker-type: ellipse;
  marker-width: 6;
  marker-fill: #FF9900;
}
#traffic_accidents[value=1] {
   marker-fill: #A6CEE3;
}
#traffic_accidents[value=2] {
   marker-fill: #1F78B4;
}
#traffic_accidents[value=3] {
   marker-fill: #B2DF8A;
}
#traffic_accidents[value=4] {
   marker-fill: #33A02C;
}
#traffic_accidents[value=5] {
   marker-fill: #FB9A99;
}
#traffic_accidents[value=6] {
   marker-fill: #E31A1C;
}
#traffic_accidents[value=7] {
   marker-fill: #FDBF6F;
}
Why do this? - Control over intensity!

Map {
-torque-frame-count:1;
-torque-animation-duration:0;
-torque-time-attribute:"cartodb_id";
-torque-aggregation-function:"count(district_i)";
-torque-resolution:1;
-torque-data-aggregation:linear;
}

#traffic_accidents{
  comp-op: source-over;
  marker-fill-opacity: 0.9;
  marker-line-color: #FFF;
  marker-line-width: 0;
  marker-line-opacity: 1;
  marker-type: ellipse;
  marker-width: 2;
  marker-fill: #FFCC00;
}
#traffic_accidents[value>1] {
   marker-fill: #FFA300;
}
#traffic_accidents[value>2] {
   marker-fill: #FF9900;
}
#traffic_accidents[value>3] {
   marker-fill: #FF5C00;
}
#traffic_accidents[value>4] {
   marker-fill: #FF6600;
}
#traffic_accidents[value>5] {
   marker-fill: #FF2900;
}
Take note that we're once again using conditional styles in CartoCSS making calculations based on >, <, o =.
Let's create a new column titled offense_n, change the type to number

In the SQL panel, let's create a ranking for our offense types:
UPDATE traffic_accidents SET offense_n = 1 WHERE offense_ty = 'traf-vehicular-homicide';
UPDATE traffic_accidents SET offense_n = 2 WHERE offense_ty = 'traffic-accident-dui-duid';
UPDATE traffic_accidents SET offense_n = 3 WHERE offense_ty = 'traf-vehicular-assault';
UPDATE traffic_accidents SET offense_n = 4 WHERE offense_ty = 'traffic-accident';
UPDATE traffic_accidents SET offense_n = 5 WHERE offense_ty = 'traffic-accident-hit-and-run';
Change the styles:
Map {
-torque-frame-count:64;
-torque-animation-duration:30;
-torque-time-attribute:"first_occu";
-torque-aggregation-function:"CDB_Math_Mode(offense_n)";
-torque-resolution:16;
-torque-data-aggregation:linear;
}

#traffic_accidents{
  comp-op: source-over;
  marker-fill-opacity: 0.6;
  marker-line-color: #FFF;
  marker-type: rectangle;
  marker-width: 8;
  marker-fill: #FF9900;
}
####SQL in CartoDB
The cartoDB platform is built on the super-powerful PostgreSQL and PostGIS which make it an incredibly robust tool for working with spatial data!
In the editor itself, it's easy to filter your data sets by using the built in SQL API.
Similar to the Styling Wizard, the 'filters' tab allows you to run queries against your datasets easily, while also making changes to lines of code in the 'SQL' tab.

###Basic Syntax
The most basic statement is:
SELECT * FROM table_nameThe * means 'all' within your defined criteria. This means that all columns are received.
Something a bit more complex may be (just an example):
SELECT
  nombre,
  altura,
  edad
FROM
  datos_de_organizacion
WHERE
  nombre = 'Santiago'
  AND (
    altura > 1.8
    OR
    altura < 1.6
)SELECTis what you're requsting (necessary)FROMcall to where the data is located (necessary)WHEREis what you're filtering out (optional)
Once you run an SQL statement, CartoDB allows you to to create a new dataset from your selection.

Let's go back to our loud music complaints map.
Lets dive a bit more into SQL so we can better understand what's possible.
###Querying data
Try this and we will break it down:
SELECT * FROM loud_music_austin
 WHERE
  ST_XMin(the_geom) > -97.7374002
What about...
SELECT * FROM loud_music_austin
WHERE
  street_name = '1ST'
AND
  method_received = 'Phone'
Now...
SELECT * FROM loud_music_austin
 WHERE
  ST_DWithin(the_geom, CDB_LatLng(30.3952962, -97.7374002), 500, true)
or...
SELECT *,
ST_Distance(the_geom, CDB_LatLng(30.3952962, -97.7374002)) d
FROM loud_music_austin
PHEW!
####Counting points in polygons
Let's bring in a new layer to make more sense of our music complaints. Click the 'Add Layer' tab in the editor.

#In the popup window select 'Data file' and, same as before, Command-click (or right click) THIS LINK and select "Copy Link Address" then paste the link into the import popup. This will bring in city council districts for Austin.

we should see our boundary polygons over our music complaint points. Let's move the polygon data under the point data by dragging and dropping the layer so that our points layer is on top.
Congratulations on making your first multi-layered map!
What we want to do now is count the instances of complaints for each boundary to determine which areas have had higher concentrations of reports.
Let's add an extra column called 'p_count' to our polygon dataset. We're going to populate this with instances of service complaints from our point data.
Copy and paste this SQL statement into your editor:
UPDATE boundaries_single_member_districts SET p_count = (SELECT count(*)
FROM loud_music_austin
WHERE ST_Intersects(loud_music_austin.the_geom, boundaries_single_member_districts.the_geom))
Going back to our Wizard, we can now make a Choropleth map of complaint instances in the various districts.
###But... Maps have a tendency to distort the truth. Which is why we need to normalize our data by area in order to make a more accurate map. Back in the SQL tab copy and paste this statement:
SELECT the_geom, the_geom_webmercator, cartodb_id, p_count,
    (p_count / (ST_Area(the_geom::geography)/100000000))
    as n_count
    FROM boundaries_single_member_districts
This time we're creating a new column named 'n_count' and running a simple mathmatical function to determine number of complaints by area, and attribute that to the polygons. When dealing in urban areas, normalizing by population in this same fashion is possible and sometimes recommended.
Let's style our map in the Wizard and see our new found accuracy shine!
####Publishing maps
- Title & Metadata
- Adding elements
- Web vs. Mobile view
- Annotations
- Infowindows & legends
- The publish button
- Map Academy
- Beginner
- Map design
- CartoDB.js – build a web app to visualize your data, allowing for more user interaction
- SQL and PostGIS – slice and dice your geospatial data
- CartoDB Tutorials
- CartoDB Editor Documentation
- CartoDB APIs
- Community help on StackExchange
- CartoDB Map Gallery
That's all! Don't forget to share your work and don't hesitate to email me with questions at [email protected]!
#Thank You!